
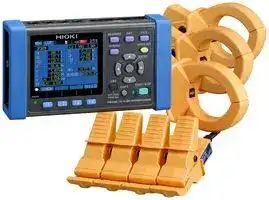


PW3365-20
Data Logger, Current, Harmonics, Power, Voltage, 3 Channel, LAN, SD Card, USB, LCD
- Manufacturer: HIOKI
- Product type:
- SVHC: To Be Advised
- Display Type: LCD
- Product Range: -
- Data Interface: LAN, SD Card, USB
- Maximum Samples: -
- Data Logger Type: Current, Harmonics, Power, Voltage
- No. of Channels / Inputs: 3 Channel
- Sensor / Measurement Type: -
| Delivery and price | |
|---|---|
| Units per pack | 1 |
| Price | 2808.36 € |
| Current stock | 10+ |
| Lead time | 30 days |
## CLAMP ON POWER LOGGER PW3365

## Eliminate the risk of short-circuits and electrical accidents

## The world’s first instrument to offer no-metal-contact power measurement

Free from the risk of short-circuit accidents since no metal comes into contact with energized parts, the Clamp On Power Logger PW3365-20 can measure voltage, current, and power right on the cable, letting you safely test in locations that were dangerous or even impossible in the past.

2016

*For Voltage Sensor PW9020

2

## Safe, Easy, Voltage Measurement

T h e  P W 3 3 6 5 - 2 0 ’s  d e d i c a t e d  v o l t a g e  s e n s o r delivers the world’s first no-metal-contact measurement.

**==> picture [437 x 133] intentionally omitted <==**

**----- Start of picture text -----**<br>
Free yourself from the risk of short-circuits by measuring right on the cable sheath with-<br>out ever needing to touch metal to energized parts<br>=a Freely clip either  ~~ Measure both thick and thin cables “<br>horizontally or vertically<br>**----- End of picture text -----**<br>


**==> picture [489 x 418] intentionally omitted <==**

**----- Start of picture text -----**<br>
Measure in potentially hazardous locations<br>| | | _ Ja) Al mys<br>Locations without  Locations with<br>energized parts covered terminals<br>Measure on the  Measure without re-<br>outside of cables moving the covers<br>Locations with a risk<br>of electric shock<br>Measure at safer points<br>i PR<br>i<br>How is voltage measured without any metallic contact?<br>Schematic diagram Voltage generator Principles of operation Voltage generator<br>Ld Ld<br>Voltage Sensor<br>PW9020 a/ prosteennnasao Internal image<br>Micro current = 0<br>2,095,05 | Electrode |<br>100V<br>© 100V (t (]r)<br>@ | B<br>Voltages<br>Measured voltage balance Generated voltage<br>Wire cross-section Electrode PW3365-20<br>m l<br>Inside the PW9020 is an electrode (a metal plate). When there is a potential difference between this electrode and the<br>measured line, a minute current flows as a result. By detecting this minute current and generating a voltage such that<br>the current declines to zero, it is possible to accurately measure the voltage without being affected by the outer diameter<br>of the measured cable or its insulation.<br>**----- End of picture text -----**<br>


3

Enlarged view of clamp

’ Actual maximum size : φ30 mm Actual minimum size : φ6 mm Compatible conductor diameters

SAFETY VOLTAGE SENSOR PW9020 Specifications

Compatible conductor types Insulated wires*[1   ] In door PVC or metal parts Compatible conductor diameters Finished outer diameter φ6mm to φ30mm Effective measurement range 90 V rms to 520 V rms Accuracy ±1.5% rdg. ±0.8 V (combined accuracy with PW3365-20)*[2]

Effect of phase Accuracy combined with the PW3365-20 is within ±1.3% (at 50 Hz/60 Hz, f.s. input)

Maximum rated CATIV 300V / CATIII 600V voltage to earth

Cord length 3m (9.84 ft)

Mass Approx. 220g (7.8 oz)

Operating temperature 0°C to 50°C(32°F to122°F), and humidity 80% RH or less (no condensation) Storage temperature -10°C to 60°C (14°F to 122°F), and humidity 80% RH or less (no condensation) Dielectric strength 7.06k Vrms AC Applicable standards Safety: EN61010,  EMC: EN61326

* includes relay box on cord

Soil, residue, or moisture on the insulated wires may result in lower voltage and power values than their true values.  Use a dry cloth to remove before measuring.

## **!**

*1: Shielded wires cannot be measured. The product may not be able to accurately measure multi-core cables or cables that have thick insulation.

- *2: For frequencies of 45 Hz to 66 Hz.

Effects of humidity: Add the following to the combined accuracy (for voltage, power, and phase) with the PW3365-20 Accuracy within ±1% f.s., phase within ±1°, measuring an insulated wire at a humidity of 70% to 80% RH Effects of adjacent wires: Add the following to the combined accuracy (for voltage and power) with the PW3365-20 Within ±1% f.s. while a wire with a phase difference of 400 V is in contact with the grip

**4**

## Review Results

## At the Worksite

## Display measured values as a graph and evaluate results at a glance

Measured values can be displayed as a graph, which is convenient when using the instrument in power management applications. Since you can statistically review not only the measured value at that moment, but also measured values that have been recorded, it’s easy to check values on the spot.

## Parameter List and Waveform Displays

## Select a display with the screen selection button

Review a list of principal test parameters, including voltage, current, power, frequency, and energy

Select the WAVE display to check voltage and current waveforms.

**List display screen**

**Waveform display screen**

## Demand Graph Display

**==> picture [128 x 18] intentionally omitted <==**

**----- Start of picture text -----**<br>
Read values at cursor<br>Maximum Demand Values<br>**----- End of picture text -----**<br>


**==> picture [29 x 6] intentionally omitted <==**

**----- Start of picture text -----**<br>
cursor<br>**----- End of picture text -----**<br>


## Display demand value trends

It’s easy to check the maximum demand value and the time at which it occurred.

Particularly useful in power management applications

**==> picture [179 x 9] intentionally omitted <==**

**----- Start of picture text -----**<br>
Evaluate Photovoltaic Generation Capabilities<br>**----- End of picture text -----**<br>


**==> picture [190 x 89] intentionally omitted <==**

**----- Start of picture text -----**<br>
P dem+<br>kW<br>as Power Purchased (consumption) P dem+<br>Time<br>Power Sold (regeneration) P dem-<br>P dem-<br>kW<br>You can create a bar graph that makes it obvious whether<br>power is being bought or sold by switching the active power<br>demand value display from consumption to regeneration<br>**----- End of picture text -----**<br>


Bar graph of values measured over a period of 24 hours at a 30-minute interval

## Trend Graph Display

**==> picture [65 x 7] intentionally omitted <==**

**----- Start of picture text -----**<br>
* Except for demand<br>**----- End of picture text -----**<br>


## Choose one measured parameter

**==> picture [89 x 10] intentionally omitted <==**

**----- Start of picture text -----**<br>
Trend Graph Display<br>**----- End of picture text -----**<br>


to create a time-series display as a graph Monitor power variations to check for connections between equipment operating status and power consumption.

Display the maximum, minimum, and average values at the cursor position

Identify these parameters right on the time-axis graph display

**==> picture [95 x 8] intentionally omitted <==**

**----- Start of picture text -----**<br>
Read values at cursor<br>**----- End of picture text -----**<br>


**==> picture [273 x 120] intentionally omitted <==**

**----- Start of picture text -----**<br>
Capture and record all fluctuations<br>Example<br>Data interval (1s to 60min)<br>Power trend graph display<br>Maximum data Maximum data<br>Maximum<br>Value<br>' Average data | t? —— Average data A neni<br>Minimum<br>Value Minimum data Minimum data<br>Average  Record  Record<br>Value Set the power logger to save all parameters to<br>record the maximum, minimum, and average values<br>during the set recording interval.<br>**----- End of picture text -----**<br>


**==> picture [185 x 7] intentionally omitted <==**

**----- Start of picture text -----**<br>
Graph of values measured over a period 24 hours at 5-minute intervals<br>**----- End of picture text -----**<br>


5

## Configure Settings with Quick Set

## Graphical, easy-to-understand guidance for connection procedures

Quick Setup guides you through the process of setting up the instrument for measurement, right up to starting measurement, on the screen to simplify set work. Since any mistaken connections will trigger a FAIL message, the feature also helps prevent measurement mistakes. If you receive a FAIL result, the instrument will also indicate the location of the problem.

## Setup Flow (example: 3P4W)

**==> picture [186 x 42] intentionally omitted <==**

**----- Start of picture text -----**<br>
STEP1 Quick Set START / Choose the wire type<br>STEP2 Connect the leads to the PW3365-20<br>**----- End of picture text -----**<br>


**==> picture [162 x 10] intentionally omitted <==**

**----- Start of picture text -----**<br>
STEP3 Connect the voltage sensor<br>**----- End of picture text -----**<br>


**==> picture [161 x 10] intentionally omitted <==**

**----- Start of picture text -----**<br>
STEP4 Connect the clamp sensors<br>**----- End of picture text -----**<br>


## Miswiring Example (Clamp Orientation)

**==> picture [155 x 10] intentionally omitted <==**

**----- Start of picture text -----**<br>
STEP5 Select the current range<br>**----- End of picture text -----**<br>


Power supply side Neither power nor power Correct Orientation pe > ' factor can be measured Point the arrow Pad \ accurately with the clamp toward the load side ~~eee~~ in the wrong orientation. Load side

**==> picture [165 x 8] intentionally omitted <==**

**----- Start of picture text -----**<br>
STEP6 Check wire connection status<br>**----- End of picture text -----**<br>


The I vector’s phase direction is The I vector’s phase direction is opposite the determination area. within the determination area. **FAIL** K **PASS** ol {0} i8:3154 iK a #8238225 Za 1123), 9661MOLT INPUT5A ollZO 1123) 9661MOI ier5A 5.1 Lap, 7) CURR PHASE 5. At eo “TL CURR PHASE P 6.2: PHASE DIFS P17. kW PHASE DIF3 DPF LAG 0.9 PE (DPF) DPFOLAG 6.9 PF (DPF) (DPF) (Ly) PHASE CHK ITEM HOTD fim any) PHASE CHK ITEM HOLD P: 6.2 kW P: 17.8 kW Power displayed value is too low

CURR PHASE If a you receive a FAIL result ce PHASE DIF3 Highlight the FAIL message with the cursor and press ENTER to view PF (DPF) (DPF) information about where the connection needs to be corrected.

Measurement

Red  means : FAIL VOLT PHASE Green  means : PASS

**6**

## Safely and Easily

## Measure Harmonic

## Measure harmonics with no-metal-contact voltage measurement technology

This useful feature has come to the PW3365, enabling the instrument to measure voltage and current harmonics in addition to power. Hioki’s no-metal-contact voltage measurement technology lets you safely and easily measure THD and the dominant 5th- and 7th-order harmonics.

## Measurement parameters

**==> picture [64 x 18] intentionally omitted <==**

**----- Start of picture text -----**<br>
Voltage<br>**----- End of picture text -----**<br>


**==> picture [126 x 91] intentionally omitted <==**

**----- Start of picture text -----**<br>
Harmonic voltage<br>Harmonic current<br>Voltage total harmonic distortion<br>Pp<br>Current total harmonic distortion<br>|<br>**----- End of picture text -----**<br>


## Screen displays

## **Current**

**==> picture [171 x 43] intentionally omitted <==**

**----- Start of picture text -----**<br>
Voltage and current levels Graph display<br>Voltage and current  List display<br>content percentage<br>**----- End of picture text -----**<br>


## **Harmonic Display**

## **Display harmonics up to the 13th order**

**Present harmonic RMS values and content percentages as a list of numerical values or graph and display total harmonic distortion ratio.**

The PW3365 can analyze voltage and current harmonic components from the fundamental wave to the 13th order on 50 Hz/60 Hz power lines.

**==> picture [94 x 9] intentionally omitted <==**

**----- Start of picture text -----**<br>
Harmonic Graph Display<br>**----- End of picture text -----**<br>


**==> picture [108 x 8] intentionally omitted <==**

**----- Start of picture text -----**<br>
Harmonic Value List Display<br>**----- End of picture text -----**<br>


You can save maximum, average, and minimum values in binary format for each time interval to the instrument’s SD card.

The Power Logger Viewer SF1001 is required in order to display data on a computer.

## **Time-series display of harmonics**

Select the fundamental wave, 3rd order, or 5th order for current harmonics to display a time-series graph.

7

## What causes harmonics?

Many electric devices incorporate power circuits with capacitor input. Such devices have rectification circuits to convert the AC power supply to DC power, and distortion in the resulting voltage and current waveforms causes harmonics.

## Power circuits that distort waveforms

**==> picture [76 x 8] intentionally omitted <==**

**----- Start of picture text -----**<br>
Typical power circuit<br>**----- End of picture text -----**<br>


**==> picture [30 x 22] intentionally omitted <==**

**----- Start of picture text -----**<br>
▼<br>**----- End of picture text -----**<br>


Voltage waveform and current waveform

Current flows only near the peak of the voltage waveform, resulting in a voltage drop that flattens the peak portion of the voltage waveform.

## **Analysis points**

Waveform as measured by an instrument designed for observing harmonics

Waveform as measured by the PW3365

**==> picture [18 x 13] intentionally omitted <==**

**----- Start of picture text -----**<br>
▼<br>**----- End of picture text -----**<br>


Current flows only near the peak of the voltage waveform

**▼**

The PW3365 displays content percentages for each harmonic voltage order as well as the voltage total harmonic distortion (THD).

**==> picture [31 x 22] intentionally omitted <==**

**----- Start of picture text -----**<br>
▼<br>**----- End of picture text -----**<br>


**==> picture [14 x 19] intentionally omitted <==**

**----- Start of picture text -----**<br>
▼<br>**----- End of picture text -----**<br>


THD and dominant orders

The instrument is especially useful for measuring the dominant 5th and 7th orders.

**8**

## Convenient Functions For the Worksite

## More Uses for the PW3365-20

The Hioki PW3365-20 is not just a power logger.  Added-value features and functions let you meet many other electrical testing applications.

## Leakage Current Measurement

## Requires optional clamp-on leak sensor

**==> picture [483 x 158] intentionally omitted <==**

**----- Start of picture text -----**<br>
Measure power + 1-channel of leakage current Leakage current results Measure 3 channels of<br>leakage current<br>Example : 3P3W2M+1-channel leakage current MEAS | U/T a AE :<br>3PoW2M4 13 | 9675 | SaWA :<br>UL RMS (¥) FND (¥) PEAK (VY) = PHASE (deg :t<br>U2 :<br>u12 :<br>Il RMS (4) FND (4) PEAK (A) = PHASE (deg H:<br>Measure leak- 12 :<br>age current 117 :<br>Measure  13 ;<br>power (mm SCREEN HOLD :<br>By capturing the RMS of the fundamental wave, you<br>can also identify the leakage current of the 50/60Hz<br>component.<br>RMS (A) RMS that includes harmonic components<br>With the ability to calculate and process data every 200ms, you can  FND (A) RMS of fundamental wave<br>do simple checks of intermittent leakage current.  Choose from aver-<br>age, maximum and/or minimum value of the measured interval.  PEAK (A) Peak value (waveform peak)<br>Load<br>Load<br>Power Source  Power Source  Load<br>Load<br>**----- End of picture text -----**<br>


## Control and Monitor from a Remote Location

Use a LAN cable to connect the PW3365-20 to a personal computer for real-time remote monitoring and measurement display on a web browser. Files recorded in the Clamp On Power Logger's internal memory or SD card are accessible via a LAN or USB connection, and are downloadable using the free PW3365-20 Setup and Download Software

**==> picture [477 x 317] intentionally omitted <==**

**----- Start of picture text -----**<br>
 Main - Windows Internet Explorer oS a=<br>€) http://192.168.1.31/ er<br>| @ P3365 Main ; 123) 266 CR] Pasioc set | . - ;<br>Main - Windows Internet Explorer >, 3 13 a '<br>OO-lerrmean  ————alo|x|[P mq } F; ie\ WPs 7 Te , Seccscea LAN gtot goaccnsesnaed LAN<br>HIOK! PW3365 Main Page » ELAPSED | =a { tot<br>(Copyright(C)2014 HIOKI EE. CORPORATION Al rights reserved. l a Te nc onl | \ J LAN ! ' HUB<br>Enter the IP address  Display the power logger's screen and make<br>in the browser. adjustments virtually by clicking the buttons and entering new information.<br>Simultaneous Measurements Other Convenient Features<br>Measure three single-phase, 2-wire circuits in the same system<br>vis<br>( »» @@ 2@<br>|al<br>=_<br>—@ Compact, lightweight Battery power Outage recovery<br>Small form factor lets you  Power the instrument for  Resume recording<br>set the power logger even  about five hours with batteries  automatically following<br>inside cramped cubicles if the power goes out recovery from a power<br>outage<br>Key lock function Display hold<br>Lock the buttons to prevent  Freeze the displayed<br>erroneous operation value for easier reading<br>Load Load<br>Power Source Power Source<br>Power Source  LoadLoad<br>Load<br>**----- End of picture text -----**<br>


**==> picture [76 x 17] intentionally omitted <==**

**----- Start of picture text -----**<br>
Enter the IP address<br>in the browser.<br>**----- End of picture text -----**<br>


## Simultaneous Measurements

Measure three single-phase, 2-wire circuits in the same system at the same time.

9

## Save & Analyze Measurement Results on PC

## Easily download and interpret data on a PC

Download the measurement results to a computer via the power logger's LAN or USB interface or its SD card. Simultaneously monitor all data in real-time, control your device and download the recorded data remotely with GENNECT One software. For more detailed analysis, Hioki’s optional SF1001 application software is recommended.

## Stora e media for data g

SD card 2GB ~~_~~ Stores up to one year’s data that is acquired at one minute intervals. Performance cannot be guaranteed on storage media other than SD cards sold by Hioki.

## Loadin data g

**==> picture [98 x 57] intentionally omitted <==**

**----- Start of picture text -----**<br>
SD card 2GB<br>a LAN interface<br>USB interface<br>**----- End of picture text -----**<br>


The SD port has a cover

## Available Recording Time

|Save Time|Save Time|Save Time|||Save Time|Save Time|
|---|---|---|---|---|---|---|
|Interval<br>time<br>Saving of<br>harmonic data:<br>OFF<br>1seconds<br>15.6days|harmonic data:|Saving of<br>harmonic data:<br>ON<br>2.8days|harmonic data:<br>Interval<br>time<br>30 seconds|Saving of<br>harmonic data:<br>OFF<br>1year||harmonic data:<br>Saving of<br>harmonic data:<br>ON<br>82.9days|
|2seconds<br>31.2days||5.5days|1minutes||1year|165days|
|5seconds<br>77.9days||13.8days|2minutes||1year|331days|
|10seconds<br>155days||27.6days|5minutes||1year|1year|
|15seconds<br>233days||41.5days|More than<br>10minites||1year|1year|
|[ Save conditions for above figures ]|[ Save conditions for above figures ]|[ Save conditions for above figures ]|||||
|Measurement target   : 3P4W<br>Storage media            :Z4001 2-GB SD card<br>Saved parameters      :All data: average, maximum, and minimum values|||||All data: average, maximum, and minimum values||
|Screen copy saving    : OFF||Screen copy saving    : OFFWaveform save: OFF|||||


In all cases, the maximum single file size for measurement data is about 200 MB. When this is exceeded, a new file is created and saving continues. The maximum recording period is one year.

## (available as a free download from the HIOKI website)

## **GENNECT One SF4000**

## **Real-time measurement (logging)**

**==> picture [256 x 157] intentionally omitted <==**

**----- Start of picture text -----**<br>
PC Application Program<br>GENNECT One Download the GENNECT One  SF4000 software from the Hioki<br>website to your PC<br>co;<br>HUB<br>Connect each measuring<br>instrument to PC with LAN cable HIOKX! ‘]<br>ie =<br>SSS~~ 9 —_ — aa» EEL 7 =<br>a, aaa Memory HiLogger<br>Power Quality Analyzer Clamp On Power Logger LR8450<br>PQ3100 PW3360/PW3365<br>(Firmware V1.20 or later)<br>**----- End of picture text -----**<br>


-Regularly (as quickly as once every second) collect measurement data from up to 30 LAN-connected measuring instruments and display it on a computer. -Simultaneously capture power data from a power meter and temperature or flow rate data from a data logger.

## **Automatic file transfer (FTP)**

**==> picture [88 x 8] intentionally omitted <==**

**----- Start of picture text -----**<br>
Remote control (HTTP)<br>**----- End of picture text -----**<br>


**Control and configure LAN-connected measuring instruments in remote locations from a computer**

## **Automatically transfer measurement files from LAN-connected instruments to a computer**

The application displays a virtual instrument and allows you to control it directly with the mouse.

This function lets you acquire data in real time on a PC, including data created when the instrument’s trigger is activated and measurement files that are automatically generated on a daily basis. Example uses include capturing abnormal phenomena with an instrument installed in the field and automatically acquiring daily power consumption data on a PC.

You can also easily change instrument settings and control the instrument, for example to start and stop measurement

**==> picture [226 x 104] intentionally omitted <==**

**----- Start of picture text -----**<br>
Automatically transfer measurement files to a PC.<br>© ° °<br>Review measured values on a PC  : ; ;<br>anytime.<br>Model No. (Order code) SF4000 Search<br>**----- End of picture text -----**<br>


## **Downloading GENNECT One SF4000  (for Windows)**

## **HIOKI website > Search**

Model No. (Order code)

Enter the model number in the search field to download the software to get started!

SF4000

**10**

## Save & Analyze Measurement Results on PC

## Use Hioki’s Power Logger Viewer to gather, view, and compare data

Assessing the status quo is the first step in saving energy. Ascertain trends by simultaneously measuring the energy needed to maintain environmental conditions and the energy needed for production by using as many individual instruments as possible throughout plants and on individual department floors. Hioki’s Power Logger Viewer SF1001 lets you download data saved at sites in the field to instruments’ SD cards and internal memory to a computer to display, tabulate, analyze, and incorporate it into printed reports.

## **Collect data that reflects changes in multiple locations and compare to gain an understanding of the big picture**

## **Example data use case 1**

**Simultaneously measure and record loads using three PW3365s.**

**==> picture [24 x 92] intentionally omitted <==**

**----- Start of picture text -----**<br>
A<br>B<br>C<br>Source  Power<br>Source  Power<br>Source  Power<br>**----- End of picture text -----**<br>


**==> picture [43 x 9] intentionally omitted <==**

**----- Start of picture text -----**<br>
Building A<br>**----- End of picture text -----**<br>


**==> picture [194 x 9] intentionally omitted <==**

**----- Start of picture text -----**<br>
You can load data from multiple instruments.<br>**----- End of picture text -----**<br>


▼ **Display easy-to-understand** [Fis nome | Cupiny sone. > **time-series graphs** Choose a line graph or bar graph depending on your purpose.

**C** | ait |TT **B** ee| in |tpt|TT N **A** ee er |||ee I wiei —chieto—chvato~—ehvodo—ehvago—oge = siv0go~—tSv0go = vevgo Thue thi0g0—rvoua hse Power 2012/11/28 23:10-00 Ready — $$ Group power consumption data for multiple locations together and display on a single graph so that you can readily identify the times and locations that are characterized by high power consumption.

**==> picture [69 x 8] intentionally omitted <==**

**----- Start of picture text -----**<br>
Consolidate data<br>**----- End of picture text -----**<br>


Consolidate up to 16 sets of data into a single file so that it can be loaded more quickly.

## **Example data use case 2**

**Display data for measurements made at different times on a single graph**

Functionality for changing the date associated with a set of data lets you change the time of data to facilitate comparison so that you can identify the benefits of energy-saving measures at a glance.

**==> picture [410 x 65] intentionally omitted <==**

**----- Start of picture text -----**<br>
| | p t} lt | | TT | TT | TT |<br>|—_ _ Change the green graph’s time __p ptf ft tek | tt tf.<br>ee ee 1. tt | fal tAPt [tt] TA<br>PT oT tT tT vty fT ► ache tt AT Ty PT<br>im i y<br>**----- End of picture text -----**<br>


11

## **Generate daily and weekly reports to review survey results and benefits**

**==> picture [458 x 360] intentionally omitted <==**

**----- Start of picture text -----**<br>
Daily<br>report 1(f—10030.00[SE3.985 50.9694 20608 | 2074s| CT205.63 [azzC3ese A a 14989]C) Example data format<br>jp 01.00:00! 0.105 s.02ig| 207.13] si | 206.71] aS | |<br>; 00:0030007T aB26] sz] 830977Sasiog ] 2 07.34Toe7{0766 ogo2f 2 06.980731 ] tant1062 tea]basa] 1 0.9955530 ]<br>OT 02:30;09 006g | sasagg| 077i 208.94 | 207.31 zag | oraz 0.300<br>jf 03:00:00] 27] 568079] 20745 208 sgf 206.94] 917] 8247] 17.028 |<br>jpjp 03:30:09OOO 204gaestssgo6t7 ezg6| | 20gOat 209.22!09.24f 207.65]207.59] nN26] agg]gat.7.837836 | Choose from four display formats<br>po 5000 sf 2024] ogg] og 27f 0784 OO] sg] 639<br>jp 5 BO;ODT SGOT 614B23 {07.99 f OT 20783] 2073} Th a<br>po 06 00;00| 2g] 7agt| 20763] 20880] 207.63] BIG | B26] 16.703 J<br>;0700-00063000TTistog2tbae11726032071320657] 207a5[20837f 207.28]206g] eof39asfagas 4075]243] Form val as a summary form.<br>jf 80000 get 673012] 2086] 209.63f 208.59] ag zig| 1.225]<br>; 083009 8.202] 6g.9023| 206.53 208.05/ 206.85] 4] eet] 11.577<br>pf 3000f 962] 5933] 20527] 206.97f 205.33] 337] |B 6<br>po{10:30:0010:00 f 2.057]aos] 726220]7ga2a7| 0493]054g] 206.20714]69f 204.97]205.47] 763]a7] gg]sos] GTBT Daily<br>pTpt30:09T 00;09T 3874757616]sai rssig] 0a049420663]206.5gf 204.1204.95] 29523900] tsgaz]azg 1441313.483} | report period.<br>{120009 [8750 T9a26s[ 204gaf 064s 20472 i3asg [S426] 13.949 |<br>po 23000] Tatas] 0512] 206.82] 205.17] a] 392] 14 84S<br>jf 300;09f 296g] sz9g45| 0asg | 206.26) 2048.69] 72gfat] 11.345 |<br>po 39009] 276] 8226] 05 92t SS 07.68t 206.00] 59] tse | 4<br>pt 30;00f 5327] sie] 0578] 20755f 20581] 356] 20610] 18 6S Weekly<br>;{1500005 30;00] oggsiz]| gts987sofagaz| 20702]059g] 2086B]0769] 207.02]2059S 3800]8S] SSO]a4] 513.950} 562 report<br>; 6 00;00T Sgt ea seif 206.70 20840 206.70 5.909T eg] 16.257<br>; BG0;OOT 82SBegoT TT OBGOT BORAT 206.71 | gif a SGT 12.920]<br>pojf73000]8:00:09 f 3a854]| 1005520]987950] 068i20732f | 0g]08.sgf 207.48]206.88] zatseg] 6203]et] 12.798}13.204] Monthly<br>[18:30:00 | 3.490 | 102.2970 | 207.17 | 208.94 | 207.15 | 12.972 | 14590] 13.209]<br>900-001 aa tosaaeo] 07a] ogi 207.33] 2sigftaeiaf 13.200] report<br>9:30:00 aa.7600] 20755] 209.2ef 2074sfzagif aaa] 13.099] period.<br>Tf 20.00:00| tag 106a210 | 206.80] 084g! 206.76] 60] ga] 193 |<br>pT 20:30:00] gif 1076870 205.76] 207.38) 205.71] S| S| 149<br>jf 2100;09T 4295] togagag 206.227 207gif 206.20 5.24ft .667] 15.799}<br>jp 230097 se] tt ti2of 20603 207607 206.04 973 tgs 10.163 J<br>pf 223000 f 900] zoogo] 20577] 207.28f 205.74] ag] gag] 7.971<br>jf 23 00;09f gaz ta ggoo| 206.72f 208.22f 206.61] 7B] nT] 10.513 J<br>pod 2330;00] 86] 5.7730] 206.99] 20842] 206.78] S24] gt] 11.420<br><2800 88 9 0 rr rrr]<br>Tota value occurred<br>pAverage ag 206.65] 208g] 206.59] 10.182] 78S | 10.724 |<br>[Maximumperme[Load factordemand |)| |P53SST]eel14:30:00 2040el4:00.00 —CSSC=Cial04:30.00BY CSCiGG|eel08:00:00 C08a!08:00:09S| RalC8356]14:30:00 SSteal14-30-0020610| —SS«*B— 14:30,00 GSO<br>[Demandfactor |)P52<br>demand time.)<br>Weekly<br>Te Pee) | ween) wy) ey dT i) dA. A) i) yt<br>report B_+ T00:00.00| 00.00.00 == 24:00.00[2ea2T24:00:00 | 2.956] 117.2040tgaisiof 20656]206.657 20798]oaigT 20657]206sgf toreorg2f antor] esT 10.72494.240 quantities are calculated:<br>paoreurys ___|00.00.00-240000| 3017] 2605560] 20628| ———20777|_———20625| ——Ssogve|——ize28| «tn. 609|<br>| 2014/03/17 | 00-00-00 = 24:00-00| 3.076 | 423.7440 2068.27 | 20782] 205.92] 600 [ra | naar Load rate and demand rate<br>| 2014/09/18 000000-240000| zea a7.eseof 206.70] 0796] 20640 zat 10720, 9882]<br>aS SS SS SS<br>jAveroge e990 206 ag | ores] 20630 tongs teg [11.169]<br>[Maximum demand ___| | ge7f 5183920} _oe.eof 209.74] z0eeo | tggo2 ff 19.715)<br>[revcimenmemceners] | 12:30: 000 0 ] seoon| _—“oranoo| [_—“onsnoo|_—“'saoveo|'tzaogo|] —"tzavan|___ta3000<br>[Coad factor IS ss 1300.00 04:30:00 0430.00 08:00:00 12:30:00 12:30:00 12:30:00<br>[Demand factor |S) ST<br>▼<br>Pate Time eePeek) | [eelWH kWh] ES WP+ [kWh]: Active energy<br>**----- End of picture text -----**<br>


## **Choose from four display formats**

**Form** Display data for a user-specified interval as a summary form. **Daily** Tabulate data by demand time and display a form summarizing a one-day **report** period. **Weekly** Tabulate data by day and display a **report** form summarizing a one-week period. **Monthly** Tabulate data by day and display a form summarizing a one-month **report** period.

**Check average and maximum values as well as the time at which the maximum value occurred** ~~SSSSSSSSSSSSSSSSSSSSSSSSSSSFSFSSSFSS~~ (Maximum values for daily, weekly, and monthly reports indicate maximum values as tabulated by demand time.)

**When demand power is selected, the following quantities are calculated:**

Active energy (consumption) from the start of recording **Pdem+ [kW]: Active power demand value** Average active power value (consumption) for each interval

## **Display harmonics and waveform data, convert to CSV format, and save screenshots**

Configure the PW3365’s recording settings to save harmonic data and display harmonics using the SF1001.

Configure the PW3365’s settings to save waveforms and display them using the SF1001.

**==> picture [348 x 72] intentionally omitted <==**

**----- Start of picture text -----**<br>
Convert binary data and  File Gan<br>save as a CSV file. CS v0.-(C . .  vErCtristst by Awm8 U1")SenerCopy : Ceri+e }<br>[LJfd open [sevetocombned]  combined fie. cri+0 ieee=a4  =gach| scumaryCraut | DataREDWe<br>Binary format file Caries = mes<br>•Harmonic data Save csv file... ►►► formatCSV  Save screen shots and paste into other<br>•Waveform data 1 C:¥Users¥...¥Power0004.da2 software or print.<br>**----- End of picture text -----**<br>


12

PW3365-20 S pecifications

No dirt or moisture on insulated wire or voltage sensor, (Accuracy guaranteed for 1 year)

## **Measurement**

**==> picture [496 x 541] intentionally omitted <==**

**----- Start of picture text -----**<br>
Number of input channels Voltage: 3 channels / Current: 3 channels<br>Single-phase 2-wire (1P2W, 1P2W  5  2 circuits, 1P2W  5  3 circuits)<br>Measurement targets Single-phase 3-wire (1P3W, 1P3W+I, 1P3W1U, 1P3W1U+I)<br>(50/60Hz) Three-phase 3-wire (3P3W2M, 3P3W2M+I, 3P3W3M/Y-wiring only)<br>Three-phase 4-wire (3P4W), Current only: 1 to 3 channels<br>Simultaneous<br>1P3W+I       : 1 power circuit and 1 current channel<br>power/current<br>measurement modes 3P3W2M+I  : 1 power circuit and 1 current channel<br>Voltage RMS value, fundamental wave value, waveform peak (absolute value), fundamental wave phase angle, frequency (U1)<br>Current RMS value, fundamental wave value, waveform peak (absolute value), fundamental wave phase angle<br>Active power, reactive power, apparent power, power factor,  (with lag/lead display) or displacement power factor (with lag/lead display),<br>Power active energy (consumption, regeneration, regeneration), reactive energy(lag, lead)<br>Measurement Energy cost display (per-kWh price × power consumption)<br>items<br>Active power demand value (consumption, regeneration),<br>Demand reactive power demand value (lag, lead),<br>active power demand quantity (consumption, regeneration), reactive power demand quantity (lag, lead),<br>power factor demand value<br>Harmonics Harmonic voltage, harmonic current, voltage total harmonic distortion (THD-F or THD-R), current total harmonic distortion (THD-F or TDH-R)<br>Display range: 5 V to 520 V (less than 5 V displays as 0 V) (harmonic voltage value of 0 indicated for all orders when voltage RMS value is 0)<br>Voltage range<br>Effective measurement range: 90 V rms to 520 V rms,  peak: ±750 V peak  [OVER] indicates over-range warning<br>CLAMP ON SENSOR 9660 : 5/10/50/100 A<br>CLAMP ON SENSOR 9661 : 5/10/50/100/500 A<br>CLAMP ON SENSOR 9669  : 100/200/1 k A<br>Load CLAMP ON SENSOR 9694 : 500 m/1/5/10/50 A<br>current CLAMP ON SENSOR 9695-02 : 500 m/1/5/10/50 A<br>CLAMP ON SENSOR 9695-03 : 5/10/50/100 A<br>Current ranges AC FLEXIBLE CURRENT SENSOR CT9667-01, -02, -03 : 50/100/500 A (500A range)<br>AC FLEXIBLE CURRENT SENSOR CT9667-01, -02, -03 : 500/1 k/5 k A (5000A range)<br>Leakage LEAK CLAMP ON SENSOR 9675 : 50 m/100 m/500 m/1/5 A<br>current LEAK CLAMP ON SENSOR 9657-10 : 50 m/100 m/500 m/1/5 A<br>Total display range: Within 0.4 to 130% of the range (zero is suppressed for less than 0.4%)<br>(harmonic current value of 0 indicated for all orders when current RMS value is 0)<br>Effective measurement range: Within 5 to 110% of the range [OVER] indicates over-range warning<br>200.00 W to 6.0000 MW<br>Depends on voltage/current combination and measured line type (see Measurement Range Configuration Tables)<br>Power ranges<br>Total display range: Within 0 to 130% of the range (“0W” display indicates zero rms voltage and/or current)<br>Effective measurement area: Within 5 to 130% of the range<br>Voltage  : ±1.5% rdg. ±0.8 V (combined accuracy with PW3365-20 + PW9020)<br>Measurement accuracy<br>Current : ±0.3% rdg. ±0.1% f.s. + clamp sensor accuracy<br>(50/60Hz)<br>Active power : ±2.0% rdg. ±0.3% f.s. + clamp sensor accuracy (power factor = 1)<br>Calculations RMS calculation/ fundamental wave calculation<br>VT ratio settings Any 0.01 to 9999.99 Selections 1/60/100/200/300/600/700/1000/2000/2500/5000<br>CT ratio settings Any 0.01 to 9999.99 Selections 1/40/60/80/120/160/200/240/300/400/600/800/1200<br>Input methods Voltage: Isolated inputs using Voltage Sensor PW9020      Current: Isolated input using a clamp-on sensor<br>Display update rate Approx. 0.5 sec (except when accessing SD card or internal memory, or during LAN/USB communication)<br>Digital sampling and zero cross synchronization calculation method<br>Sampling: 10.24 kHz (2048 points)<br>Measurement method Calculation processing<br>50 Hz: Continuous, gapless measurement at 10 cycles<br>60 Hz: Continuous, gapless measurement at 12 cycles<br>**----- End of picture text -----**<br>


*1 For individual clamp sensors’ accuracy and combined accuracy figures, see pages 14 and 15.

**==> picture [496 x 129] intentionally omitted <==**

**----- Start of picture text -----**<br>
Harmonic Specifications<br>Standard IEC 61000-4-7:2002 (but without harmonics for intermediate orders)<br>Window width 50 Hz: 10 cycles; 60 Hz: 12 cycles (with interpolation)<br>Analyzed orders Up to 13th order<br>Harmonic levels: Voltage and current harmonic level for each order<br>Analysis parameters (With 3P3W2M connection, U12 and I12, which are calculated as part of third channel computations, are not displayed.)<br>Harmonic content percentages: Voltage and current content percentages for each order; total harmonic distortion: voltage and current (THD-F or THD-R)<br>Harmonic level<br>Voltage    PW3365 alone: ±5% rdg. ±0.2% f.s.<br>Measurement accuracy Combined accuracy for PW3365 and PW9020: ±30% rdg. ±3% f.s. (input for each order up to 5% of the fundamental wave, THD-F up to 10%)<br>   Current    ±5% rdg. ±0.2% f.s. + sensor accuracy<br>   Total harmonic distortion: Accuracy not defined<br>**----- End of picture text -----**<br>


13

## **Screen Display**

|List|Voltage, current, frequency, active/apparent/reactive power<br>power factor, integrated power use, elapsed time|
|---|---|
|U/I|RMS value, fundamental wave value,<br>waveform peak, phase angle|
|Power|Per-channel and total active power, apparent power, reactive<br>power,power factor|
|Integ|Active energy, reactiv energy, recording start time<br>recording stop time, elapsed time, energy cost|
|Demand|Active power demand value, reactive power demand value<br>power factor demand value|
|Waveform|Displays voltage and current waveform|
|Zoom|Enlarged view of 4 user-selected parameters|
|Trend|For one selected measurement item (not including harmonics<br>other than demand and THD) displays maximum, average and<br>minimum values|
|Harmonics|Displays voltage and current levels and content percentages as<br>a graph or list|


## **Recording**

|Save destination|SD Card, internal memory (capacity: approx. 320 KB)|
|---|---|
|Save interval<br>time|<br>1/2/5/10/15/30 seconds, 1/2/5/10/15/20/30/60 minutes<br>Available storage time is displayed on the PW3365-20's setting screen|
|Save items|Measurement save : Average only/all (without harmonics)<br> Average only/all (with harmonics)<br>Screen save : Saves the displayed screen as a BMP at a fxed interval*<br>1<br>Waveform save : Stores binary waveform data*<br>2|
|Recording start methods|Interval time, manual, or at specifed time, repeat|
|Recording stop methods|Manual, or at specifed time (up to one year),timer|


*1 The minimum interval time for saving screen copies is 5 min. If the setting is less than 5 min., screen copies will be saved every 5 min.

*2 With shortest interval of 1 minute.When set to less than 1 minute, waveforms are saved once every minute

|**External Interfaces**|**External Interfaces**|
|---|---|
|SD card|Settings data, measurement data, screen data, waveform data|
|LAN|100BASE-TX IEEE802.3 Compliance<br>- HTTP server function, FTP server function|
|USB|USB Ver 2.0,Windows 10 (32/64bit)/Windows 8 (32/64bit)/<br>Windows 7 (32/64bit) / Vista (32bit) /XP<br>- When connected to a computer, the SD Card and internal<br>memoryare recognized as removable storage devices.|


|**General**||
|---|---|
|Product guarantee|3 year|
|Display|3.5 inch TFT color LCD (320 × 240 pixel)|
||Japanese, English, Chinese, Korean, German, Italian, French,<br>Spanish, Turkish<br>Backlight auto-off function (after 2 minutes)<br>When AUTO OFF is active,the Power LED blinks|
|Operating<br>environment|Indoors, Pollution degree 2, altitude up to 2000 m (6562-ft.)|
|Operating<br>temperature and<br>humidity<br>(no condensation)|-10°C to 50°C (14°F to 122°F), 80% RH or less<br>During battery operation: 0°C to 40°C (32°F to 104°F), 80% RH or less<br>During battery charging: 10°C to 40°C (50°F to 104°F), 80% RH or less|
|Storage<br>temperature and<br>humidity<br>(no condensation)|0°C to 60°C (32°F to 140°F), 80% RH or less<br>However, the batterys storage temperature<br>range is -10°C to 30°C (14°F to 86°F)|
|Maximum rated voltage<br>between terminals|<br>Voltage input section : 1.7 VAC, 2.4 Vpeak<br>Current input section : 1.7 VAC, 2.4 Vpeak|
|Maximum rated<br>voltage to earth|Voltage input section: 600V Measurement Category III<br>300V Measurement Category IV<br>Current input section: Depends on clamp sensor in use.|
|Dielectric strength|7.06 kVrms AC|
|Applicable standards|Safety: EN61010,  EMC: EN61326|
|Power supply|(1)Z1008 AC Adapter: 100 V AC to 240 V AC<br>Maximum rated power : 45 VA(including AC adapter)<br>(2)Model 9459 Battery Pack :  Ni-MH DC7.2 V 2700 mAh<br>Continuous battery operation time Approx. 5 hr.<br>Maximum rated power : 3 VA|
|Charge function|Charge time: Max. 6 hr. 10 min. (reference value at 23°C)<br>Charges the battery regardless of whether the instrument is on or off|
|Backup<br>battery life|Clock and settings (Lithium battery),<br>Approx. 10 years @23°C (@73.4°F)|
|Dimensions|Approx. 180W(7.09") × 100H(3.94") × 48D (1.89") mm (without PW9002)|
||Approx. 180W(7.09") × 100H(3.94") × 68D (2.68") mm (with PW9002)|
|Mass|Approx. 540g (19 oz) (without PW9002), Approx. 820g (28.9 oz) (with PW9002)|
|Accessories|SAFETY VOLTAGE SENSOR PW9020 (4)<br>AC ADAPTER Z1008 (1)<br>USB cable (1)<br>Instruction manual (1)<br>Measurement guide (1)<br>Red, yellow, blue and white color clips (4 each)<br>Spiral tubes (10)|


## POWER LOGGER VIEWER SF1001 Specifications

## **Functions**

|**Functions**||
|---|---|
|Trend graph<br>display function|Display items<br>Voltage, current, active power, reactive power, apparent power,<br>power factor, frequency, integrated active power, integrated<br>reactive power, demand volume, demand value, voltage dis-<br>equilibrium factor|
||Stacked bar graph display : Up to 16 types of data series|
||<br>Cursor measurements<br>Measurement values can be displayed by the cursor|
|Summary dis-<br>play<br>function|Displayed items are the same as for the trend Graph Display|
||Daily, weekly and monthly report displays: Accumulates and dis-<br>plays daily, weekly and monthly reports over specifed period.|
||Load factor calculation display: Calculates and displays load factor<br>and demand factor results with daily, weekly and monthly reports|
||Time span aggregation: Aggregates data into up to four speci-<br>fed time spans|
|Waveform display|Displays waveform data at specifed date and time|
|Copyfunction|Captures any display image to the clipboard|


|s||
|---|---|
|Print function|Preview and print content shown on the trend graph, report,<br>harmonic graph and settings displays.|
||Comment entry (Text comments can be entered in any printout)|
||Header/Footer settings: Sets the header and footer for each printout|
||Printing support<br>Any color or monochrome printing supported by the operating system|
|Report printing|Print (static) contents over a specifc time period|
||Output contents: Standard or selected output items|
||Available output items: Trend graph, summary, daily report, waveform|
||Report creation method: Standard print|
||Report output settings: Save/load report output settings|
|**General Specifications**||
|Supported models|PW3365-20 / PW3360-20 / PW3360-21<br>LR5000 series ; Datapreviouslyloaded bythe LR5000 Utility (.hrp2 format)usinga PC|
|Supported<br>computer<br>operating systems|Windows 10 (32/64bit)<br>Windows 8 (32/64bit)<br>Windows 7 SP1 or later (32/64bit)|


||**General Specifications**|
|---|---|
||Supported models<br>PW3365-20 / PW3360-20 / PW3360-21<br>LR5000 series ; Datapreviouslyloaded bythe LR5000 Utility (.hrp2 format)usinga PC<br>Supported<br>computer<br>operating systems<br>Windows 10 (32/64bit)<br>Windows 8 (32/64bit)<br>Windows 7 SP1 or later (32/64bit)|


14

## Current  CLAMP

CLAMP ON SENSOR 9694 9660 Cord length Cord length 3 m (9.84ft) 3 m (9.84ft)

CLAMP ON SENSOR 9660

Measurable conductor diameter φ15 mm (0.59") φ15 mm (0.59") Primary current rating 5 A AC 100 A AC

CLAMP ON SENSOR 9661

Cord length 3 m (9.84ft)

φ46 mm (0.81")

500 A AC

CLAMP ON SENSOR 9669

**==> picture [33 x 14] intentionally omitted <==**

**----- Start of picture text -----**<br>
Cord length<br>3 m (9.84ft)<br>**----- End of picture text -----**<br>


φ55 mm  (2.17") 80 (3.15")×20 (0.79") mm

1000 A AC

Insulated Insulated conductor conductor CLAMP ON SENSOR CLAMP ON SENSOR 9695-02 9695-03 Connect with the 9695-02/-03, CONNECTION CORD Output BNC terminalCord length: 3 m (9.84ft) $9 9219

φ15 mm (0.59")

φ15 mm (0.59")

50 A AC 100 A AC

Accuracy  Amplitude (45 to 66 Hz)  / Phase (45 Hz to 5 kHz) ±0.3% rdg.±0.02% f.s. ±0.3% rdg.±0.02% f.s. ±0.3% rdg.±0.01% f.s. Within ±2° Within ±1° Within ±0.5° Frequency characteristic 40Hz to 5kHz Within ±1.0% Within ±1.0% Within ±1.0%

±1.0% rdg.±0.01% f.s. Within ±1°

Within ±2.0%

±0.3% rdg.±0.02% f.s. ±0.3% rdg.±0.02% f.s. Within ±2° Within ±1°

Within ±1.0%

Within ±1.0%

Effect of external magnetic field with a magnetic field of 400 A/ m AC Equivalent to 0.1 A or less Equivalent to 0.1 A or less Equivalent to 0.1 A or less

Equivalent to 0.1 A or less

Equivalent to 1 A or less

Equivalent to 0.1 A or less

Equivalent to 0.1 A or less

Effect of conductor position Within ±0.5% Within ±0.5%

Maximum rated voltage to earth CAT III 300 V rms CAT III 300 V rms

Maximum input 45-66 Hz 50 A continuous 130 A continuous

Within ±0.5%

CAT III 600 V rms

550 A continuous

Within ±1.5% CAT III 600 V rms 1000 A continuous

Within ±0.5%

CAT III 300 V rms 60 A continuous

Within ±0.5%

CAT III 300 V rms

130 A continuous

Dimensions / Mass 46W × 135H × 21D mm / 230 g 46W × 135H × 21D mm / 230 g (1.81") × (5.31") × (0.83") / (8.1 oz) (1.81") × (5.31") × (0.83") / (8.1 oz)

77W × 151H × 42D mm / 380 g (3.03") × (5.94") × (1.65") / (13.4 oz)

99.5W×188H×42D mm/ 590 g (3.92")×(7.40")×(1.65") / (20.8 oz)

50.5W×58H×18.7D mm / 50 g 50.5W×58H×18.7D mm / 50 g (2.28")×(2.28")× (0.74") / (1.8 oz) (2.28")×(2.28")×(0.74") / (1.8 oz)

**==> picture [117 x 51] intentionally omitted <==**

**----- Start of picture text -----**<br>
Insulated  Insulated<br>conductor conductor<br>4 4<br>**----- End of picture text -----**<br>


CT9667-01 CT9667-02 CT9667-03 AC FLEXIBLE CURRENT SENSOR

Cord length : Sensor - circuit: 2 m (6.56ft) , Circuit - connector: 1 m (3.28ft)

CT9667-01 : φ100 mm, CT9667-02 : φ180 mm CT9667-03 : φ254 mm : φ254 mmφ254 mm254 mm AC500 A/ AC5000 A (Switchable)

Measurable conductor diameter CT9667-03 : φ254 mm : φ254 mmφ254 mm254 mm Primary current rating AC500 A/ AC5000 A (Switchable) Accuracy 45-66Hz ±2.0% rdg ± 0.3% f.s. / Within ±1° Frequency 10-20kHz Within ± 3dB Effect of external 1.5% / f.s.  or less magnetic field Effect of Within ± 3% conductor position Maximum rated CAT III 1000 V rms / CAT IV 600 V rms voltage to earth Maximum input 45-66Hz 10000 A continuous Circuit box: 35W×120.5H×34D Dimensions / Mass CT9667-01, -02 : 280 g, CT9667-03 : 470 g LR06 alkaline battery × 2 or Power supply AC ADAPTER 9445-02/9445-03 (optional)

Measurable conductor diameter

Primary current rating Accuracy Frequency 40 - 5kHz

Effect of external magnetic field Effect of conductor position Measurable conductor

Maximum input 45-66Hz Dimensions / Mass

Notes

CLAMP ON LEAK SENSOR 9657-10 Leakage Current Measurement Only

CLAMP ON LEAK SENSOR 9675 Leakage Current Measurement Only

Cord length : 3 m (9.84ft)

Cord length : 3 m (9.84ft)

φ40 mm AC 10 A*

φ30 mm AC 10 A*

±1.0% rdg ±0.05% f.s. / Within ±3° ±1.0% rdg ±0.05% f.s. / Within ±5°

Within ± 5% Within ± 5% 7.5 mA max. 7.5 mA max. Within ±0.1% Within ±0.1% Insulated conductor Insulated conductor 30A continuous 10A continuous 74W× 145H × 42D / 380g 60W× 112.5H × 23.6D / 160g Not used for power measurements Not used for power measurements *Maximum AC measurement range with Maximum AC measurement range with *Maximum AC measurement range with PW3365-20 is 5 A PW3365-20 is 5 A

*Maximum AC measurement range with Maximum AC measurement range with PW3365-20 is 5 A

15

## Measurement Range Configurations

## CLAMP ON SENSOR 9694 / 9695-02[*1]

**==> picture [245 x 199] intentionally omitted <==**

**----- Start of picture text -----**<br>
Current<br>Voltage Connection<br>500.00 mA 1.0000 A 5.0000 A 10.000 A 50.000 A<br>1P2W 200.00 W 400.00 W 2.0000 kW 4.0000 kW 20.000 kW<br>1P3W<br>1P3W1U<br>400.0 V 400.00 W 800.00 W 4.0000 kW 8.0000 kW 40.000 kW<br>3P3W2M<br>3P3W3M<br>3P4W 600.00 W 1.2000 kW 6.0000 kW 12.000 kW 60.000 kW<br>CLAMP ON SENSOR 9660 / 9695-03 / 9661 [*2]<br>Current 9661 only<br>Voltage Connection<br>5.0000 A 10.000 A 50.000 A 100.00 A 500.00 A<br>1P2W 2.0000 kW 4.0000 kW 20.000 kW 40.000 kW 200.00 kW<br>1P3W<br>1P3W1U<br>400.0 V 4.0000 kW 8.0000 kW 40.000 kW 80.000 kW 400.00 kW<br>3P3W2M<br>3P3W3M<br>3P4W 6.0000 kW 12.000 kW 60.000 kW 120.00 kW 600.00 kW<br>**----- End of picture text -----**<br>


## CLAMP ON SENSOR 9669

**==> picture [245 x 345] intentionally omitted <==**

**----- Start of picture text -----**<br>
Current<br>Voltage Connection<br>100.00 A 200.00 A 1.0000 kA<br>1P2W 40.000 kW 80.000 kW 400.00 kW<br>1P3W<br>1P3W1U<br>400.0 V 80.000 kW 160.00 kW 800.00 kW<br>3P3W2M<br>3P3W3M<br>3P4W 120.00 kW 240.00 kW 1.2000 MW<br>AC FLEXIBLE CURRENT SENSOR CT9667-01, -02, -03 (5 kA)<br>Current<br>Voltage Connection<br>500.00 A 1.0000 kA 5.0000 kA<br>1P2W 200.00 kW 400.00 kW 2.0000 MW<br>1P3W<br>1P3W1U<br>400.0 V 400.00 kW 800.00 kW 4.0000 MW<br>3P3W2M<br>3P3W3M<br>3P4W 600.00 kW 1.2000 MW 6.0000 MW<br>AC FLEXIBLE CURRENT SENSOR CT9667-01, -02, -03 (500 A)<br>Current<br>Voltage Connection<br>50.00 A 100.00 A 500.00 A<br>1P2W 20.000 kW 40.000 kW 200.00 kW<br>1P3W<br>1P3W1U<br>400.0 V 40.000 kW 80.000 kW 400.00 kW<br>3P3W2M<br>3P3W3M<br>3P4W 60.000 kW 120.00 kW 600.00 kW<br>Leak current: CLAMP ON LEAK SENSOR 9657-10, 9675<br>Range 50.000 mA/ 100.00 mA/ 500.00 mA/ 1.0000 A/ 5.0000 A<br>**----- End of picture text -----**<br>


## Combined Accuracy

PW3365-20 + PW9020 + clamp sensors

**==> picture [246 x 552] intentionally omitted <==**

**----- Start of picture text -----**<br>
Range 9694 9695-02<br>50.000 A - ±2.3% rdg. ±0.32% f.s.<br>10.000 A - ±2.3% rdg. ±0.4% f.s.<br>5.0000 A ±2.3% rdg. ±0.32% f.s. ±2.3% rdg. ±0.5% f.s.<br>1.0000 A ±2.3% rdg. ±0.4% f.s. ±2.3% rdg. ±1.3% f.s.<br>500.00 mA ±2.3% rdg. ±0.5% f.s. ±2.3% rdg. ±2.3% f.s.<br>Range 9660, 9695-03 9661<br>500.00 A - ±2.3% rdg. ±0.31% f.s.<br>100.00 A ±2.3% rdg. ±0.32% f.s. ±2.3% rdg. ±0.35% f.s.<br>50.000 A ±2.3% rdg. ±0.34% f.s. ±2.3% rdg. ±0.4% f.s.<br>10.000 A ±2.3% rdg. ±0.5% f.s. ±2.3% rdg. ±0.8% f.s.<br>5.0000 A ±2.3% rdg. ±0.7% f.s. ±2.3% rdg. ±1.3% f.s.<br>Range 9669<br>1.0000 kA ±3% rdg. ±0.31% f.s.<br>200.00 A ±3% rdg. ±0.35% f.s.<br>100.00 A ±3% rdg. ±0.4% f.s.<br>Range CT9667-01, -02, -03  5.000kA range CT9667-01, -02, -03  500A range<br>5.0000 kA ±4% rdg. ±0.6% f.s. -<br>1.0000 kA ±4% rdg. ±1.8% f.s. -<br>500.00 A ±4% rdg. ±3.3% f.s. ±4% rdg. ±0.6% f.s.<br>100.00 A - ±4% rdg. ±1.8% f.s.<br>50.000 A - ±4% rdg. ±3.3% f.s.<br>Conditions of  After 30 minute warm-up, with 50/60 Hz sine wave input<br>guaranteed accuracy voltage to earth 400V  or less<br>Temperature and humidity 23˚C ±5˚C (73 ± 9°F), 80%RH or less<br>for guaranteed accuracy (applies to all specifications unless otherwise noted)<br>Display area<br>Effective measurement range<br>of guaranteed accuracy<br>Within ±0.3 sec/day (with power on, within specified<br>Real-time clock accuracy<br>operating temperature and humidity ranges)<br>Temperature characteristic Within ±0.1% f.s./ ˚C (except 23±5°C)<br>Effect of external  Within ±1.5% f.s.<br>magnetic field (in a magnetic field of 400 A/m rms AC, 50 Hz/60 Hz)<br>Effect of radiated,  Within ±5% f.s.<br>radio-frequency,<br>electromagnetic field for voltage and active power at 10 V/m<br>Apparent power ±1 dgt. for the calculation obtained from each measurement value<br>Fundamental waveform calculations<br>±2.0% rdg. ±3.0% f.s. + clamp-on sensor accuracy (w/power factor = 1)<br>Reactive power<br>Rms calculations<br>From each measurement applied to calculation ±1 dgt.<br>Energy Active and reactive power measurement accuracies ±1 dgt.<br>Power factor From each measurement applied to calculation ±1 dgt.<br>Frequency ±0.5% rdg. (with 90 to 520 V sine wave input)<br>Demand value Active and reactive power measurement accuracies ±1 dgt.<br>Demand quantity Active and reactive power measurement accuracies ±1 dgt.<br>**----- End of picture text -----**<br>


*1 For the 9694 sensor, the range of guaranteed accuracy is from 500 mA to 5 A, and for the 9695-02, from 500 mA to 50 A.

*2 For the 9660 and 9695-03 sensors, the range of guaranteed accuracy is from 5 A to 100 A and for the 9661, from 5 A to 500 A.

## Current Display and Effective Measurement Ranges

typical

**==> picture [503 x 103] intentionally omitted <==**

**----- Start of picture text -----**<br>
Total display range Effective measurement range Total display range Effective peak<br>Range<br>Minimum Minimum Maximum Maximum Range<br>Voltage 400 V Range 5.0 V 90.0 V 520.0 V 520.0 V ±750 V peak<br>5 A Range 0.0200 A 0.2500 A 5.5000 A 6.5000 A ±20 A peak<br>10 A Range 0.040 A 0.500 A 11.000 A 13.000 A ±40 A peak<br>Current 50 A Range 0.200 A 2.500 A 55.000 A 65.000 A ±200 A peak<br>100 A Range 0.40 A 5.00 A 110.00 A 130.00 A ±400 A peak<br>500 A Range 2.00 A 25.00 A 550.00 A 650.00 A ±1000 A peak<br>**----- End of picture text -----**<br>


## Accessories

**==> picture [127 x 76] intentionally omitted <==**

**----- Start of picture text -----**<br>
* Current sensors :<br>sold separately<br>oi e<br>_ *For Voltage  2016 * For PW3365 serene het<br>* Voltage sensors : bundled Sensor<br>**----- End of picture text -----**<br>


Model : CLAMP ON POWER LOGGER PW3365 Model No. (Order Code) (Note) PW3365-20 (English model, main unit only)

- SAFETY VOLTAGE SENSOR PW9020 ×4 • AC ADAPTER Z1008 ×1 • USB cable (0.9 m, 2.95 ft length) ×1 • Instruction manual ×1 • Measurement guide ×1 • Color clips (red, green, yellow, white) 4 each • Spiral tubes ×10

Clamp On Power Logger PW3365-20 by itself does not support current and power measurements. Current and power measurements require clamp on sensors, sold separately.  Use only HIOKI SD cards guaranteed to work for saving measurement data (options, sold separately).

## Options

## CLAMP ON SENSOR (for load current measurement)

**==> picture [128 x 8] intentionally omitted <==**

**----- Start of picture text -----**<br>
CLAMP ON ADAPTER 9290-10<br>**----- End of picture text -----**<br>


CLAMP ON SENSOR 9694 (AC 5 A) Primary side CLAMP ON SENSOR 9660 (AC 100 A) 1000 A CLAMP ON SENSOR 9661 (AC 500 A) CLAMP ON SENSOR 9669 (AC 1000 A) yy, AC FLEXIBLE CURRENT SENSOR CT9667-01 (AC 500 A/ 5000 A) ifSWAy AC FLEXIBLE CURRENT SENSOR CT9667-02 (AC 500 A/ 5000 A) RI AC FLEXIBLE CURRENT SENSOR CT9667-03 (AC 500 A/ 5000 A) CLAMP ON SENSOR[(Not CE marked)] * 9695-02 (AC 50 A) CLAMP ON SENSOR[(Not CE marked)] * 9695-03 (AC 100 A) CAT III 600 V Secondary side CONNECTION CORD 9219 (for connection to 9695-02, 9695-03) Cord length: 3 m (9.84 ft) 100 A *[When purchasing the 9695-02 and 9695-03, we recommend also purchasing ] the separately sold 9219 Connection Cord. Measurable conductor diameter CLAMP ON LEAK SENSOR (for leakage current measurement) φ55 mm (2.17 in) Bus bar : 80 mm (3.46in) 5 20 mm (0.79 in) CLAMP ON LEAK SENSOR 9657-10 CT ratio : 10:1 CLAMP ON LEAK SENSOR 9675 MAX. 1500 A AC (continuous: 1000 A)

**==> picture [498 x 247] intentionally omitted <==**

**----- Start of picture text -----**<br>
POWER LOGGER VIEWER SF1001 BATTERY SET PW9002 SAFETY VOLTAGE SENSOR PW9020 CARRYING CASE C1005/C1008<br>“ fy<br>The photo shows C1008.<br>Battery Case and Battery Pack Set<br>Supported BATTERY PACK 9459 C1005 C1008<br>computer operating systems For purchase  PW3365-20 is bundled with 4 sensors Dimension : 390W (15.4") 390W (15.4")<br>Trend graph display functionSummary display function as replacement battery pack  Additional single sensors also availableCord length: 3 m (9.84 ft) (               110DApprox)      275H  (4.3")(10.8") mm 150D275H (10.8") (5.9") mm<br>Waveform display, Print function<br>Report printing<br>AC ADAPTER Z1008 SD MEMORY CARD Z4003 SD MEMORY CARD 2GB Z4001 LAN CABLE 9642<br>a. SA A<br>8 GB capacity 2 GB capacity oo<br>Includes  standard Stores up to one year’s data when acquired at one minute intervals. Performance  Straight Ethernet cable, supplied with straight to<br>For separate purchase cannot be guaranteed on storage media other than Hioki-specified SD card options. cross conversion adapter, 5 m (16.41 ft) length<br>Note: Company names and product names appearing in this catalog are trademarks or registered trademarks of various companies.<br>**----- End of picture text -----**<br>


**==> picture [62 x 7] intentionally omitted <==**

**----- Start of picture text -----**<br>
DISTRIBUTED BY<br>**----- End of picture text -----**<br>


## **HEADQUARTERS**

81 Koizumi, Ueda, Nagano 386-1192 Japan https://www.hioki.com/

All information correct as of Mar. 11, 2022.  All specifications are subject to change without notice.

PW3365E14-23M      Printed in Japan
Updated at June 4, 2026
Hioki is a distinguished manufacturer recognized globally for its innovative and precision-driven test and measurement solutions. The company develops advanced, high-quality instruments designed to meet the rigorous demands of engineers, technicians, and researchers across the electronics, automotive, and energy sectors. Within its comprehensive portfolio of measurement technology, Hioki is particularly noted for its highly reliable data acquisition and data logging systems. Their precision dataloggers are meticulously engineered to gather crucial information with unparalleled accuracy, enabling professionals to seamlessly monitor, record, and analyze complex electrical and environmental phenomena over time. Built with a commitment to user-friendly operation and robust performance, Hioki instruments are designed to streamline complex workflows and accelerate both research and industrial diagnostics. By delivering exceptional build quality and consistent, verifiable results, the brand remains a trusted choice for critical measurement tasks and long-term data collection.
About Novapart
Novapart is a B2B electronic component broker specialising in stock shortages and cost reduction. We source hard-to-find parts and identify compliant alternatives across a catalogue of 410,000+ components from 500+ manufacturers.
Learn more →Stock Shortage Specialist
When a component is unavailable, discontinued or has an unacceptable lead time, we tap into our network of vetted European and Asian distributors to source what you need — without compromising on quality or traceability.
Request a quote →Compliant Alternatives
We identify pin-to-pin, electrically equivalent substitutes that meet the same certifications (RoHS, AEC-Q100, REACH) as your original specification — validated against datasheets, not just part numbers. Often at a lower cost.
BOM Analysis service →