
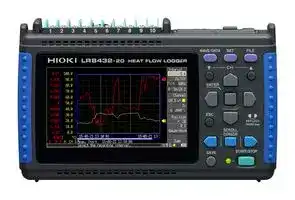


LR8432-20
Data Logger, Temperature & Voltage, 14 Channel, CF Card, USB, LCD
- Manufacturer: HIOKI
- Product type:
- SVHC: No SVHC (21-Jan-2025)
- Display Type: LCD
- Product Range: -
- Data Interface: CF Card, USB
- Maximum Samples: -
- Data Logger Type: Temperature & Voltage
- No. of Channels / Inputs: 14 Channel
- Sensor / Measurement Type: -
| Delivery and price | |
|---|---|
| Units per pack | 1 |
| Price | 1459.92 € |
| Current stock | 10+ |
| Lead time | 30 days |
MEMORY HiLOGGER LR8431 HEAT FLOW LOGGER LR8432

**inverters used in electric and Evaluating motors and inverters used in electric and hybrid vehicles hybrid vehiclesEfficiency measurement and performance evaluation of air conditioning equipment Temperature measurement and performance evaluation of internal components in electronic equipment MEMORY HiLOGGER LR8431**

## **Small and light enough for the palm of your hand-yet completely isolated**

## **Your Personal 10-channel Logger**

**Ideal for evaluating insulation performance and analyzing the causes of temperature change HEAT FLOW LOGGER LR8432**

**2**

MEMORY HiLOGGER LR8431

**This compact logger excels in a broad range of settings, from production lines to research and development**

## **Evaluating motors and inverters used in electric and hybrid vehicles**

The LR8431 achieves high speed measurements, isolated inputs, and stable measurements that are less affected by noise

## **Efficiency measurement and performance evaluation of air conditioning equipment**

The LR8431 supports simultaneous, multi-point measurement, for example of input and output at multiple air conditioners or the temperature of internal components

**Temperature measurement and performance evaluation of internal components in electronic equipment**

Used with a wind velocity converter, the LR8431 can measure cooling efficiency inside equipment enclosures

**3**

**==> picture [99 x 6] intentionally omitted <==**

**----- Start of picture text -----**<br>
HEAT FLOW LOGGER LR8432<br>**----- End of picture text -----**<br>


## **Ten Isolated Analog Input Channels**

There’s no need to worry about differing potentials of measurement objects when measuring temperature and voltage. All ten analog channels are isolated. Even when measuring temperature and voltage at the same time, interchannel interference and electric shock hazards are eliminated. The four pulse channels are ideal for counting revolution pulses to measure rotation speed. (Pulse inputs share common ground.)

Note: Isolation between channels is possible through the use of semi-conductor relays. Voltage exceeding the product specifications, such as that originating from lightning surges or other sources, should never be applied between each channel; otherwise the relays will short and the recorder will be damaged.

## **High-Speed Sampling**

## 10 ms Sampling and Recording Across All Channels

Abrupt changes in load need to be measured during development of EV[• ] HV[• ] PHV, for which multi-channel, 10 ms sampling is essential. This HiLOGGER can track waveforms that could not be followed with the 100 ms sampling interval previously available.

**==> picture [270 x 88] intentionally omitted <==**

**----- Start of picture text -----**<br>
10ms sampling<br>10ms sampling<br>|<br>100ms sampling 100ms sampling<br>ut ta a<br>Measurement comparison of abrupt  Measurement comparison of 5 Hz<br>**----- End of picture text -----**<br>


(using the supplied Logger Utility program)

## **Enhanced Noise Suppression**

## Noise-resistant measurement circuitry for improved readings

Measurement involves the deployment of a delta-sigma type A/D converter. Suppress inverter switching noise and line-frequency hum by digital filtering with the HiLOGGER's proprietary oversampling technology.

Note: Optimum noise suppression is obtained for recordings at least two seconds long.

(using the supplied Logger Utility program)

**4**

## **Easy and convenient measurement of heat flow**

The measurement of heat is useful for achieving more accurate air conditioning control and implementing measures against heat during product development. UA |

With temperature fluctuation, there is always a migration of heat. Heat is energy that causes a change in temperature, and it moves from high to low in the same way as water and electricity.

The degree of this migration is referred to as "heat flow” and is expressed as the amount of heat energy that flows through a given area over a given period of time (units: W/m[2] ).

Temperature is the result, while heat flow is the process. Temperature fluctuation (heat generation or absorption) cannot be understood solely through temperature measurements using thermocouples and thermography.

To get the complete picture, use a heat flow sensor to visualize the movement and volume of heat energy as a leading indicator of temperature fluctuation.

Measure multiple areas where heat is generated in order to combat heat sources in a variety of consumer electronics.

Measure the flow of heat in human bodies to understand the conduction efficiency of heat in materials and fabrics under development.

Applicable to the development of bathroom floor materials and clothing

Regularly diagnose the heat flow of thermal insulation material used to understand the deterioration of thermal insulation performance over time.

Predict room temperature management in greenhouses affected by external temperature fluctuation.

**ground and the sides of a greenhouse before cooling the inside.** hPa

**5**

## **Familiar operability and a variety of functions for heat flow measurement***

*Functions for LR8432 only

## **High sensitivity range of 10mV f.s.**

High sensitivity of 10 mV f.s. for the measurement of minute heat flow.

## **Function for time-delimited calculation**

Calculate average and maximum values for each specified time.

Take accurate and reliable measurements, even in areas with small temperature fluctuations and for the evaluation of high thermal insulation materials.

## **Simple settings for the heat flow sensor**

Avoid troublesome calculations by directly entering the sensitivity of the heat flow sensor.

Use segmented calculations to determine and save average values and maximum values for each time block (units: minutes).

## **Display heat flow and temperature gauges simultaneously**

Display the gauges for data you want to compare at the same time in order to see changes in temperature and heat flow at a single glance.

Simply enter the sensitivity of the heat flow sensor to complete the settings

Heat flow      Temperature (°C) (W/m[2] )

## **Real-time calculation function**

## Waveform calculations

The LR8432 has a convenient, built-in waveform calculations function for the analysis of temperature and heat flow. Record raw waveforms and post-calculation waveforms at the same time. (Heat transmission coefficient processing, simple average, moving average, and integration)

**==> picture [104 x 7] intentionally omitted <==**

**----- Start of picture text -----**<br>
Real-time calculation of integration<br>**----- End of picture text -----**<br>


**==> picture [118 x 8] intentionally omitted <==**

**----- Start of picture text -----**<br>
Real-time calculation of moving average<br>**----- End of picture text -----**<br>


## Numerical calculations

Integrate with numerical calculations. Display the sum of energy as a numerical value.

**==> picture [87 x 6] intentionally omitted <==**

**----- Start of picture text -----**<br>
Real-time calculation of sum<br>**----- End of picture text -----**<br>


**==> picture [93 x 19] intentionally omitted <==**

**----- Start of picture text -----**<br>
Moving average waveform<br>Raw waveform<br>**----- End of picture text -----**<br>


~~€-PEDEHDED~~ Integration at specified intervals

## **6 Functions and Interfaces**

A variety of transducer outputs (DC voltage), or thermocouple measurements up to 10 channels 4 Pulse (count) input channels, 1 alarm output channel Real-time save & long-term recording to CF Card or USB memory

Terminal 1: GND

**==> picture [326 x 33] intentionally omitted <==**

**----- Start of picture text -----**<br>
Terminal 2: Trigger output<br>USB Interface CF Card slot<br>Terminal 3: External trigger input<br>(for real-time data saving) (for real-time data saving)<br>Terminal 4: Alarm output<br>**----- End of picture text -----**<br>


Recording time (save to external storage in real-time of binary data)

**==> picture [267 x 185] intentionally omitted <==**

**----- Start of picture text -----**<br>
Note: When saving in CSV data format, total recording time is 1/10 or shorter of the following<br>Recording All Channels (ten analog, four pulse and one alarm)<br>(When waveform calculation is not set)<br>Recording intervals a Internal memory (7 MB) 512 MB 1 GB 2 GB<br>10 ms a 32 m 1 d 15 h 14 m  3 d 06 h 29 m  6 d 12 h 58 m<br>20 ms a 1 h 04 m 3 d 06 h 29 m  6 d 12 h 58 m  13 d 01 h 57 m<br>50 ms a 2 h 40 m 8 d 04 h 13 m  16 d 08 h 26 m  32 d 16 h 53 m<br>100 ms a 5 h 21 m  16 d 08 h 26 m  32 d 16 h 53 m  65 d 09 h 47 m<br>200 ms a 10 h 43 m  32 d 16 h 53 m  65 d 09 h 47 m  130 d 19 h 35 m<br>500 ms a 1 d 02 h 49 m  81 d 18 h 14 m 163 d 12 h 29 m  327 d 00 h 59 m<br>1 s a 2 d 05 h 39 m  163 d 12 h 29 m 327 d 00 h 59 m  " H "<br>2 s a 4 d 11 h 18 m  327 d 00 h 59 m  " H " " H "<br>5 s a 11 d 04 h 16 m  " H " " H " " H "<br>10 s a 22 d 08 h 33 m  " H " " H " " H "<br>20 s a 44 d 17 h 06 m  " H " " H " " H "<br>30 s a 67 d 01 h 39 m  " H " " H " " H "<br>1 min a 134 d 03 h 18 m  " H " " H " " H "<br>2 min a 268 d 06 h 36 m  " H " " H " " H "<br>5 min to 1 hour a " H " " H " " H " " H "<br>**----- End of picture text -----**<br>


Voltage Temperature measurement (using thermocouples) Heat flow (LR8432 only)

- _For more reliable data protection, we recommend use of HIOKI CF cards which are manufactured to strict industrial standards, for real-time data save or long-term storage of important data. Media other than CF cards, which are HIOKI genuine options, are not guaranteed to work._

- _USB communication function and saving to USB memory are not available at the same time._

- _Maximum recording time is inversely proportional to number of recording channels._

- _Because the header portion of waveform files is not included in capacity calculations, expect actual maximum times to be about 90% of those in the table._

• " H " _Exceeds 365 days._

Use the supplied Logger Utility program to control real-time data recording from the PC. Scroll backward through the displayed trend graph window to view past waveforms even while recording.

|Collect data in real-time with a computer<br>**Logger Utility**(Accessory)<br>Use the supplied Logger Utility program to control real-time data|Collect data in real-time with a computer<br>**Logger Utility**(Accessory)<br>Use the supplied Logger Utility program to control real-time data|Collect data in real-time with a computer<br>**Logger Utility**(Accessory)<br>Use the supplied Logger Utility program to control real-time data|~~=~~<br>~~L~~|
|---|---|---|---|
|Use the supplied Logger Utility program to control real-time data<br>recording from the PC. Scroll backward through the displayed|||USB|
|trend graph window to view past waveforms even while recording.||||
||||Logger Utility|
|Operating|Windows7 (32bit/64bit), Windows8 (32bit/64bit)|Waveform|Supported files: Waveform data file (LUW format, MEM format)|
|environment<br>Overview<br>Function|Windows10 (32bit/64bit)<br>Control PC-connected logger to receive, display and save measured<br>waveform data sequentially. (Total recording samples: maximum 10<br>million data. Data exceeding this number will be segmented into sepa-<br>rate measurement files while recordingcontinues.)<br>Controllable loggers: 5<br>Data collection system: 1 system<br>Display:  Simultaneous display of waveforms (split time-axis display is<br>possible), numerical values (logging), and alarms. Numerical display<br>can be enlarged.|display<br>Waveform<br>calculation|Display format:Simultaneous display of waveforms (split time-axis display is possible),<br>numerical values (logging), and alarms.<br>Maximum number of channels: 2035 channels (measured) + 60 channels (waveform calculation)<br>Waveform display sheets: Waveform of each channel can be displayed on any of the ten sheets<br>Scroll: Available<br>Event mark recording: Available<br>Cursors: Cursors A and B can be used to display voltage values at cursor positions<br>Hard copy: Hard copyof waveform displayavailable<br>Calculation items: Arithmetic operations<br>Number of calculation channel: 60 channels|
||Numerical value monitor display:  Display in a separate window is possible.|Numerical|Applicable data: Waveform data file (LUW format, MEM format), real-time measure-|
||Scroll:  Waveforms can be scrolled duringmeasurement.|calculations|ment data, waveform calculation|
|Data<br>collection|Settings: Data collection settings of logger unit can be configured.<br>Monitor function can be checked before measurement.<br>Save: Save settings from multiple devices supporting real-time measure-<br>ment (LUS format) and measurement data (LUW format) as one file||Calculation items: Average value, peak value, maximum value, time to maximum value,<br>minimum value, time to minimum value, on time, off time, on count, off count, standard<br>deviation, aggregation, area value, and integration<br>Save calculation: Perform numerical calculation and save to file|
||Data save destination: Real-time data collection file (LUW format),|Search|Applicable data: Real-time data collection file (LUW format), main unit measurement|
||transfer data in real-time or non-real-time to Microsoft Excel®, Excel®||file (MEM format), waveform calculation data|
||template can be specified||Search mode: Event mark, date and time, maximum position, minimum position, local|
||Event mark: Recordingduringmeasurement ispossible||maximumposition,local minimumposition,alarmposition,level,window,and variation|
|Data|Applicable files: Waveform data file (LUW format, MEM format)|Print|Applicable printer: Printer compatible to the OS in use|
|conversion|Conversion section: All data, specified section||Applicable data: Waveform data file (LUW format, MEM format)|
||Conversion format: CSV format (comma delimited, space delimited, tab||Print format: Waveform image, report print, list print (channel settings, event, cursor value)|
||delimited), transfer to Excel®sheet, LR5000 format (hrp2,hrp)||Print area: All area, specified area by A-B cursor|
||Data thinning: Simple thinningwith anythinningnumber||Printpreview: Available|


7

For LR8432 only

(Accuracy guaranteed for 1 year) Basic Specifications

Analog inputs: 10 channels, isolated (M3 mm dia. screw terminal block)

*Electrically isolated between channels, and from chassis ground Input impedance: 1 MΩ (when measuring heat flow, voltage, or temperature with Input system/ a thermocouple and the burn-out detection is off), 800 kΩ (with thermocouple Number of input channels burn-out detection on) Pulse inputs: 4 channels (requires CONNECTION CABLE 9641) _Note: all pulse inputs share common ground with logger._ Maximum rating: 60 V DC (max. voltage between input terminals without damage) Analog inputs Maximum rated voltage from isolated terminals to ground: 30 V AC rms, 60 V DC (max. voltage between input channel terminals, and from terminals to chassis ground without damage) Input limits: 0 to +10 V DC (max. voltage between input terminals without damage) Non-isolated: Common ground between pulse input channels, and with chassis Pulse inputs Pulse signal characteristic: No-voltage relay contact a, open collector or voltage input (high: 2.5 V or more, low: 0.9 V or less) Period: at least 200 µs (both high and low periods at least 100 µs) 1 channel, non-isolated: output from external control connector (common ground) Signal criteria: configurable high/low threshold levels, enter/exit threshold window, logical sum (OR) and logical product (AND) for every input channel. Alarm output Output is refreshed each time recording starts. Signal characteristic: Open drain output (active low, with voltage output) Voltage levels: 4.0 to 5.0 V (high) and 0 to 0.5 V (low), Max. sink current: 5 mA DC, Max. applied voltage: 30 V DC Internal memory 3.5 MWords  (7 MB of two-byte data points, or four-byte pulse measurements) CF card: CF card slot × 1 (Up to 2 GB) Data format: FAT, FAT32 External memory USB memory: USB 2.0 High-speed capable, series mini-B receptacle, Data format: FAT, FAT32 Backup battery life for clock and settings: approx. 5 years Backup function For measurement data: 100 hours with fully charged battery pack, or (@25°C) for as long as AC adapter is connected Control terminals External trigger/event mark input (exclusion function), trigger output, alarm output Display 4.3-inch WQVGA-TFT color LCD (480 × 272 dots) Display languages English, Japanese One USB 2.0 series mini B receptacle External interface Functions: Control from a PC (Ver 1.00 or later), transfers internal data on the CF card to a PC Environmental Temperature and humidity range for use: 0°C to 40°C (32°F to 104°F), conditions (or 5°C to 30°C (41°F to 86°F) when battery charging), 80% rh or less (no condensation) Storage: -10°C to 50°C (14°F to 122°F), 80 % rh or less Standard compliance Safety: EN61010, EMC: EN61326, EN61000 AC ADAPTER Z1005: 100 to 240 V AC, 50/60 Hz, 30 VA Max. (including AC adapter), 10 VA Max. (Logger only) Power supply BATTERY PACK 9780: 2.5 h continuous operating time (@25°C/77°F), 3 VA Max. External power source: 10 to 16 V DC, 10 VA Max. (Please contact HIOKI for connection cord. Max length 3 m/9.84 ft.) Continuous operating Approx. 2.5 hours (with Battery Pack Model 9780 while saving to the CF card) time Charging time: Approx. 200 minutes (@5°C to 30°C/41°F to 86°F ambient) Dimensions and weight[Approx. 176 mm (6.93 in.) W × 101 mm (3.98 in.) H × 41 mm (1.61 in.) D, ] 550 g (19.4 oz.) (HEAT FLOW LOGGER only) Measurement Guide ×1, CD-R (Instruction manual PDF, Logger Utility Accessories Instruction Manual PDF, Data acquisition application program Logger Utility) ×1, USB cable ×1, AC Adapter Z1005 ×1 Trigger Functions Trigger source All analog and pulse channels P1 to P4, external trigger, logical sum (selectable for each channel) (OR) and product (AND) of each trigger source Criteria: Short-circuit between external trigger input and ground, or voltage input  (high-low transition from [3.0 – 5 V] to [0 – 0.8 V]) External trigger Pulse width: At least 1 ms (high), and 2 µs (low) Input limits: 0 to 7 V DC Trigger timing Start, stop and start/stop  (different trigger criteria can be set to start and stop) Level: Triggers when rising or falling through preset threshold Trigger types Window: Triggers when entering or exiting range defined by preset (Analog, Pulse) upper and lower thresholds Level setting Analog: 0.025% f.s. (f.s. = 10 display divisions) resolution Pulse: Totalization 1 count, rotations 1/n [r.s]  (n: pulses per rotation) Records for a specified period before triggering; can be set for real-time Pre-trigger saving (1) Output signal at trigger occurred (2) Output signal at start or trigger occurred Selectable between mode (1) or (2) Trigger output Open collector (active low, with voltage output, at least 10 ms pulse width, Voltage levels: 4.0 to 5.0 V (high) and 0 to 0.5 V (low), Max. sink current: 5 mA DC, Max. applied voltage: 30 V DC) Measurement Settings Recording intervals 10 ms to 1 hour, 19 selections (sampling period) _Note: All input channels are scanned at high speed during every recording interval_ Graph timebase scaling[100 ms to 1 day per division, 21 selections] _Note: These settings are different than recording interval_ (On/off) Enable to repeat recording after the specified recording time span has Repeating recording elapsed Enable continuous recording (continuous recording until the Stop key is Recording time pressed), or disable to record for a specified time span (days, hours, minutes and seconds) On (measurement with specified start time, stop time, and recording Timer recording interval), or off

||For LR8432 only|
|---|---|
|Auto saving|Waveform data(binary or CSV): Real-time saving to CF card or USB<br>memory while measuring<br>Numerical calculation results: stores calculated values to the CF card or USB<br>memory when finished measuring<br>_Note: Do not power down while data is saving_|
|Real-time saving|Each recording can be saved in a separate file<br>Delete and save: New data overwrites the oldest data when the storage<br>media is full<br>Divided saving: Save data at a specified interval(days, hours and minutes)<br>Divided saving: Specified time (specify a time of day at which to start saving data<br>to files at a specified interval)<br>_Note: Do not power down while data is saving_|
|Load stored data|Stored data can be recalled by the logger in 3.5 MWord (7 MB)quantities<br>(for a single channel; less for multiple channels)|
|Settable save/reload|Configure saving and reloading to and from CF card or USB memory or<br>internal memory<br>Ten types for internal memory, no limit for CF card and USB memory|
|Numerical calculations|Calculation 1 to Calculation 4, simultaneous calculation possible,<br>Selections: average value, peak value, maximum value, minimum value,<br>time to maximum value, time to minimum value, integration|
|Calculation range|After stopping: all data in internal buffer memory or between AB cursors<br>While measuring: all data in internal buffer memory<br>Time-delimited calculation: Calculate at the specified times, and display the<br>latest calculated values(only while measuring)|
|Auto save of calculated<br>results|Possible: Automatically save the final calculated values in text format to<br>CF card or USB memory after measurement<br>Time-delimited calculation: Save calculation values in real-time at the<br>specified times in text format to CF card or USB memory|
|Selectable filters|50 Hz, 60 Hz, or off (digital filtering of high frequencies on analog channels)|


## Channel Settings

|Channel settings|Enable/disable measurement (on/off), selectable waveform color<br>Analog channels (10): Voltage, heat flow, temperature(thermocouple only).<br>Thermocouple types K, J, E, T, N, R, S, B<br>Pulse input channels (4): Count Integration or revolutions<br>Alarm output (1): Hold/not-hold, beeper enable/disable (on/off), show/<br>hide alarm waveform display (on/off)<br>Waveform calculations 10ch|Enable/disable measurement (on/off), selectable waveform color<br>Analog channels (10): Voltage, heat flow, temperature(thermocouple only).<br>Thermocouple types K, J, E, T, N, R, S, B<br>Pulse input channels (4): Count Integration or revolutions<br>Alarm output (1): Hold/not-hold, beeper enable/disable (on/off), show/<br>hide alarm waveform display (on/off)<br>Waveform calculations 10ch|Enable/disable measurement (on/off), selectable waveform color<br>Analog channels (10): Voltage, heat flow, temperature(thermocouple only).<br>Thermocouple types K, J, E, T, N, R, S, B<br>Pulse input channels (4): Count Integration or revolutions<br>Alarm output (1): Hold/not-hold, beeper enable/disable (on/off), show/<br>hide alarm waveform display (on/off)<br>Waveform calculations 10ch|
|---|---|---|---|
|Accuracy guarantee<br>conditions|Warm-up time: 30 minutes or more, after zero-adjustment<br>Cutoff frequency setting: 10 Hz/50 Hz/60 Hz|||
|Measurement targets|Range|Range of measurements|Max. resolution|
|Voltage<br>Heat flow|10 mV f.s.|-10 mV to +10 mV|500 nV|
||100 mV f.s.|-100 mV to +100 mV|5 μV|
||1 V f.s.|-1 V to +1 V|50 μV|
||10 V f.s.|-10 V to +10 V|500 μV|
||20 V f.s.|-20 V to +20 V|1 mV|
||100 V f.s.|-60 V to +60 V|5 mV|
||1 to 5 V*|1 V to 5 V|500 μV|
||Accuracy: ±0.1 % f.s.( *1 - 5 V range's f.s. = 10 V)|||
|Measurement targets|Range|Range of measurements|Max. resolution|
|Temperature<br>(Thermocouples)|2000˚C (3632˚F) f.s.|-200˚C to 2000˚C<br>(-328˚F to 3632˚F)|0.1˚C (0.18˚F)|
|Temperature input<br>ranges<br>(JIS C 1602-1995)|(K) -200˚C to 1350˚C (-328˚F to 2462˚F)<br>(J) -200˚C to 1200˚C (-328˚F to 2192˚F)<br>(E) -200˚C to 1000˚C (-328˚F to 1832˚F)<br>(T) -200˚C to 400˚C (-328˚F to 752˚F)<br>(N) -200˚C to 1300˚C (-328˚F to 2372˚F)<br>(R)      0˚C to 1700˚C (32˚F to 3092˚F)<br>(S)       0˚C to 1700˚C (32˚F to 3092˚F)<br>(B)  400˚C to 1800˚C (752˚F to 3272˚F)|||
|Measurement accuracy|K, J, E, T: ±1.0°C (1.8°F)(-100°C/-148°F or more), ±1.5°C (2.7°F)(-200°C to -100°C/-328°F to -148°F)<br>N: ±1.2°C (2.16°F)(-100°C/-148°F or more), ±2.2°C (3.96°F)(-200°C to -100°C/-328°F to -148°F)<br>R, S: ±2.2°C (3.96°F)(300°C/572°F or more), ±4.5°C (8.1°F)(0°C to 300°C/32°F to 572°F)<br>B: ±2.5°C (4.5°F)(1000°C/1832°F or more), ±5.5°C (9.9°F)(400°C to 1000°C/752°F to 1832°F)<br>Reference junction compensation [RJC] accuracy: ±0.5°C (0.9°F)<br>(horizontal placement), ±1°C (1.8°F)(upright placement)<br>Internal [RJC] (internal reference junction compensation at 0°C/32°F):<br>Measurement accuracy = (temp. measurement accuracy) + (RJC accuracy)<br>External [RJC] (using external junction compensation at 0°C/32°F):<br>Measurement accuracy = temp. measurement accuracy only|||
|Temperature other functions|Thermocouple burn-out detection: on or off|||
|Measurement targets|Range|Range of measurements|Max. resolution|
|Pulse<br>(Integration count)|1000 M (count) f.s.|0 to 1000 M (count)|1 (count)|
||Addition: integration value from start, Instantaneous value: instantaneous<br>value during each recording period|||
|Pulse<br>(RPM)|5000/n(r/s)f.s.|0 to 5000/n(r/s)|1/n(r/s)|
||Settable pulses per rotation: 1 to 1000<br>("n" above is the number of sensor output pulses per rotation)|||
|Slope setting|↑(count of low-to-high pulse transitions),↓(count of high-to-low pulse transitions)|||
|Display range|Specified by position, or by upper/lower display limit values<br>(Upper/lower limit values only at Totalization mode)|||
|Waveform calculations|Use the four calculations between channels (+, −, ×, ÷) to display as data<br>for the calculated channels (W1 to W10) (only when measuring).<br>Calculate the data for the set channels using simple averaging,<br>movement averaging, integration, and heat transmission coefficient  to<br>display as data for the calculated channels (W1 to W10) (only when<br>measuring).|||


## Model: MEMORY HiLOGGER LR8431

Model No. (Order Code) (Note) LR8431-20 (10 ch, English model)

## Model: HEAT FLOW LOGGER LR8432

Model No. (Order Code) (Note) LR8432-20 (10 ch, English model)

Common accessories:

Measurement Guide ×1, CD-R (Instruction manual PDF, Logger Utility Instruction Manual PDF, Data acquisition application program Logger Utility) ×1, USB cable ×1, AC Adapter Z1005 ×1

AC Adapter (standard accessory) A Sy AC ADAPTER Z1005 100 to 240 V AC

## CF card

**==> picture [459 x 202] intentionally omitted <==**

**----- Start of picture text -----**<br>
CF card USB memory<br>For more reliable data protection we recommend use of HIOKI CF cards, which are manufactured<br>to strict industrial standards, for long-term storage of important data.<br>PC PC Card Precaution a)<br>Use only PC Cards sold by HIOKI. Compatibility and performance<br>are not  guaranteed for PC cards made by other manufacturers.<br>You may be unable to read from or save data to such cards. USB DRIVE Z4006<br>PC CARD 2G 9830 16 GB, long-life, high-reliability<br>PC CARD 1G 9729 SLC Flash Memory<br>PC CARD 512M 9728<br>Input cables Battery Other Case<br>CONNECTION CABLE 9641 BATTERY PACK 9780 PROTECTION SHEET 9809 SOFT CASE 9812 CARRYING CASE 9782<br>For pulse inputs,  NiMH, charges while  For LCD protection,  For storing small accessories;  For storing optional<br>1.5 m (4.92 ft.) length installed in the main unit pairs of additional sheets Neoprene rubber accessories; resin exterior<br>**----- End of picture text -----**<br>


_Note: Company names and product names appearing in this brochure are trademarks or registered trademarks of various companies._

DISTRIBUTED BY

## **HEADQUARTERS**

81 Koizumi, Ueda, Nagano 386-1192 Japan https://www.hioki.com/

All information correct as of Feb. 6, 2024.  All specifications are subject to change without notice.

LR8431_LR8432E4-42B
Updated at June 4, 2026
Hioki is a distinguished manufacturer recognized globally for its innovative and precision-driven test and measurement solutions. The company develops advanced, high-quality instruments designed to meet the rigorous demands of engineers, technicians, and researchers across the electronics, automotive, and energy sectors. Within its comprehensive portfolio of measurement technology, Hioki is particularly noted for its highly reliable data acquisition and data logging systems. Their precision dataloggers are meticulously engineered to gather crucial information with unparalleled accuracy, enabling professionals to seamlessly monitor, record, and analyze complex electrical and environmental phenomena over time. Built with a commitment to user-friendly operation and robust performance, Hioki instruments are designed to streamline complex workflows and accelerate both research and industrial diagnostics. By delivering exceptional build quality and consistent, verifiable results, the brand remains a trusted choice for critical measurement tasks and long-term data collection.
About Novapart
Novapart is a B2B electronic component broker specialising in stock shortages and cost reduction. We source hard-to-find parts and identify compliant alternatives across a catalogue of 410,000+ components from 500+ manufacturers.
Learn more →Stock Shortage Specialist
When a component is unavailable, discontinued or has an unacceptable lead time, we tap into our network of vetted European and Asian distributors to source what you need — without compromising on quality or traceability.
Request a quote →Compliant Alternatives
We identify pin-to-pin, electrically equivalent substitutes that meet the same certifications (RoHS, AEC-Q100, REACH) as your original specification — validated against datasheets, not just part numbers. Often at a lower cost.
BOM Analysis service →